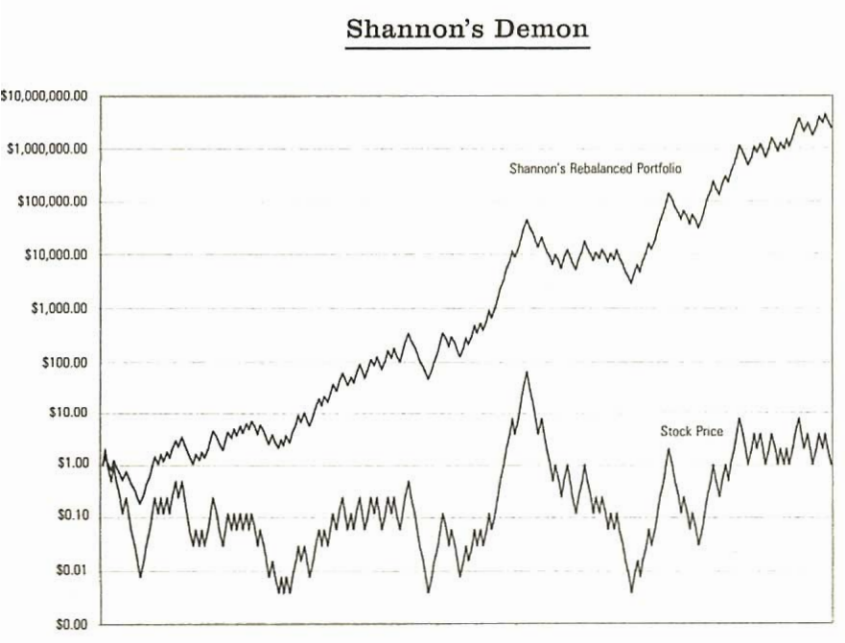
(Excerpt from Fortune’s Formula by William Poundstone)
Imagine youstart with $1,000, $500 in stock and $500 in cash. Suppose the stock halves in price the first day. (It’s a really volatile stock.) This gives you a S750 portfolio with $250 in stock and $500 in cash. That is now lopsided in favor of cash. You rebalance by withdrawing S125 from the cash account to buy stock. This leaves you with a newly balanced mix of $375 in stock and $375 cash.
Now repeat. The next day, let’s say the stock doubles in price. The $375 in stock jumps to $750. With the $375 in the cash account, you have $1,125. This time you sell some stock, ending up with $562.50 each in stock and cash.
Look at what Shannon’s scheme has achieved so far. After a dramatic plunge, the stock’s price is back to where it began. A buy-and-hold investor would have no profit at all. Shannon’s investor has made $125.
This scheme defies most investors’ instincts. Most people are happy to leave their money in a stock that goes up. Should the stock keep going up, they might put more of their free cash into the stock. In Shannon’s system, when a stock goes up, you sell some of it. You also keep pumping money into a stock that goes down—”throwing good money after bad.”
Look at the results. The lower line of the chart shows the price of an imaginary stock that starts at $1 and either doubles or halves in price each time unit with equal probability. This is a geometric random walk, a popular model of stock price movements. The basic trend here is neither up nor down. The lower line therefore represents the wealth of a buy-and-hold investor who has put all her money in the stock (assuming no dividends).

