(Excerpt from Just Keep Buying by Nick Maggiulli)
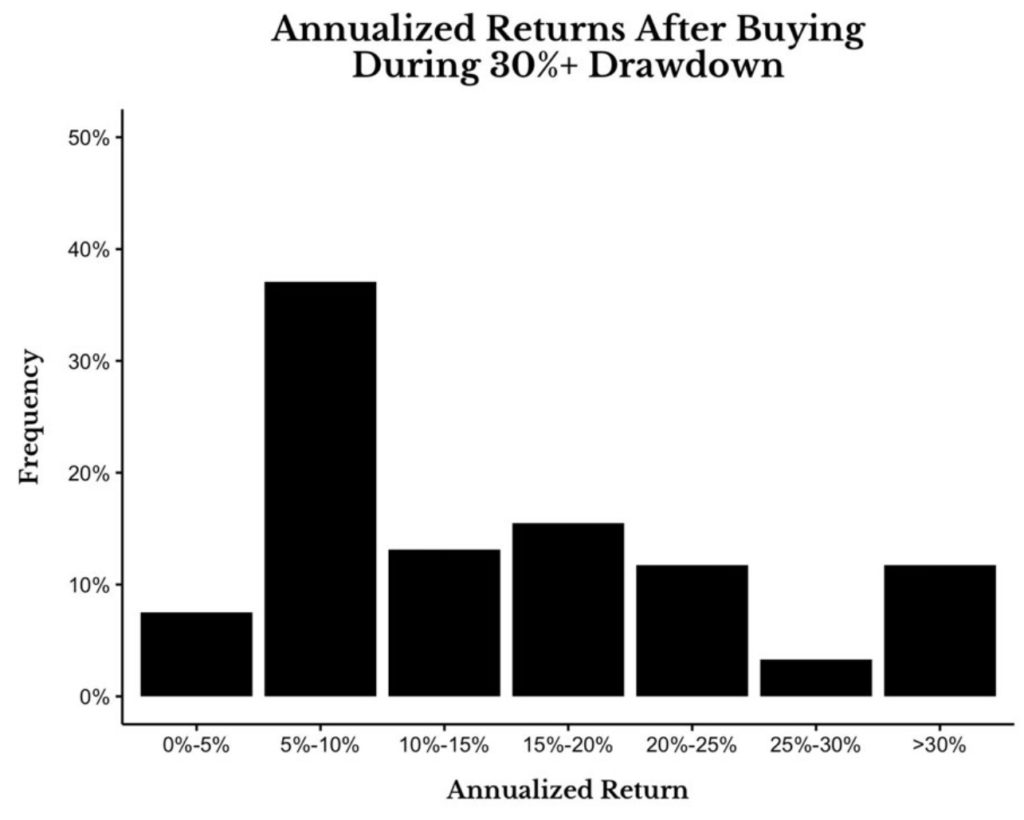
The next chart illustrates this. It shows the distribution of your annualized returns if you were to buy during any month when U.S. stocks were down by 30% (or more) from 1920–2020. The returns shown are from when stocks first were down 30% (or more) until their next all-time high.

This chart implies that there is a less than 10% chance that you would have experienced 0%–5% annualized returns (including dividends and adjusting for inflation) when buying while the market was down at least 30%. In fact, more than half the time, your annualized return during the recovery would have exceeded 10% per year. You can see this if you add the 0%–5% bar and the 5%–10% bar together, which totals less than 50%.
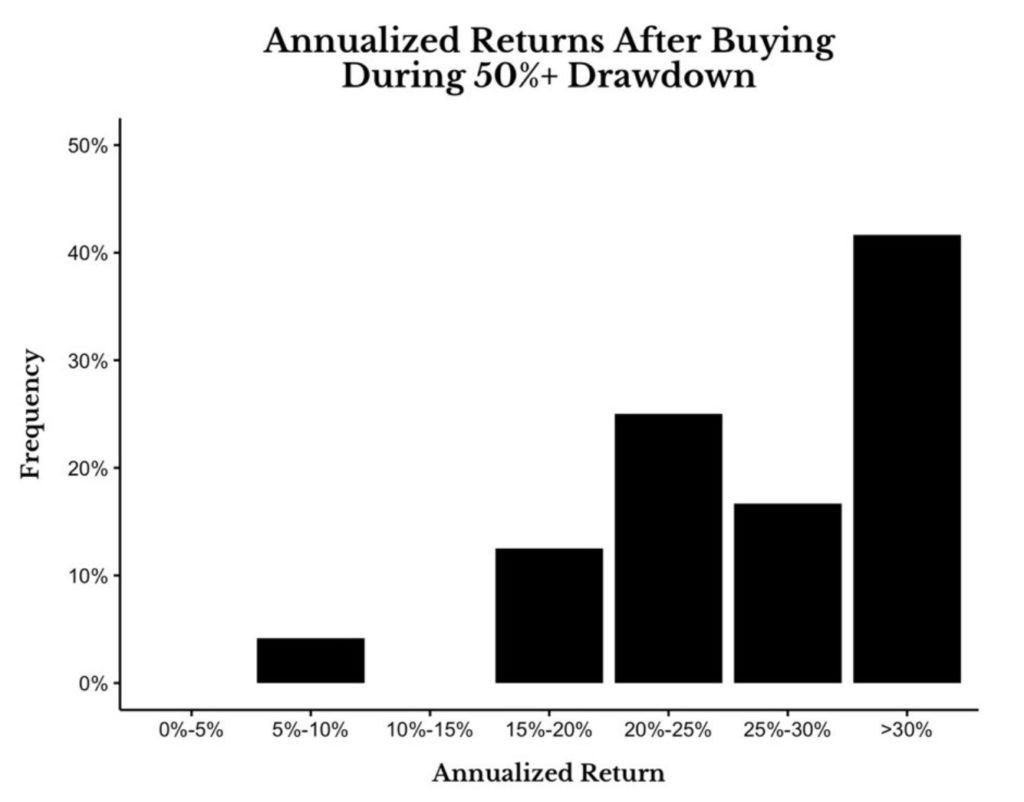
… If we subset the data to include only those periods where the market was down 50% (or more) from 1920-2020, your future returns would look even more attractive.

…when U.S. equity markets have gotten cut in half, the future annualized returns usually exceed 25%. This implies that when the market is down by 50%, it’s time to back up the truck and invest as much as you can afford.
